Visualization on Marker Gene
This dataset contains 4,714 cells from the Red Nucleus region of the human midbrain, as part of the Human Brain Cell Atlas. For more details, refer to the description. It is available for free download in h5ad format from the CELLxGENE website via this link: Download Link.
Hierarchical Clustering of the Data
import requests
import anndata
import CellScope
from scipy.sparse import issparse
import numpy as np
url = "https://datasets.cellxgene.cziscience.com/5488ff72-58ed-4f0d-913c-1b6d4d8412b1.h5ad"
file_path = "Siletti-1.h5ad"
response = requests.get(url, stream=True)
if response.status_code == 200:
    with open(file_path, "wb") as f:
        for chunk in response.iter_content(chunk_size=8192):
            f.write(chunk)
adata = anndata.read_h5ad("Siletti-1.h5ad")
fea_raw = adata.X
cell_types = adata.obs['cell_type']
Gene_Name = adata.var['feature_name']
label = np.array(cell_types)
fea_raw,fea_log,fea = CellScope.cs.Normalization(fea_raw)
fea_Fitting_1, Signal_Space, Center_index = CellScope.cs.Manifold_Fitting_1(fea)
if issparse(fea_Fitting_1):
    fea_Fitting_1 = fea_Fitting_1.toarray()
fea_Fitting_2, fitting_index, index_after_outlier_removal = CellScope.cs.Manifold_Fitting_2(fea_Fitting_1)
T_all_1 = CellScope.cs.GraphCluster(fea_Fitting_1)
T_all_2 = CellScope.cs.GraphCluster(fea_Fitting_2)
Y_1 = CellScope.cs.Visualization(fea_Fitting_1)
Y_2 = CellScope.cs.Visualization(fea_Fitting_2)
Identify the marker genes for Cluster 3-1 and Cluster 3-2
Y_initial, label_step0, Y_1, Title_1, Y_all, Title_all, index_1, index_all, step0, step1 = CellScope.ts.generate_tree_structured(fea_Fitting_1, T_all_1, step0 = None, step1 = 8)
cluster1 = index_all[2]
cluster2 = index_all[3]
label = T_all_1[:,8]
marker_gene_indices,_ = CellScope.fm.FindMarker(fea_log, cluster1, cluster2, selected_number = 5, selected_method = 'diff pct')
marker_gene_name = np.array(Gene_Name[marker_gene_indices])
CellScope offers various visualization methods for marker genes
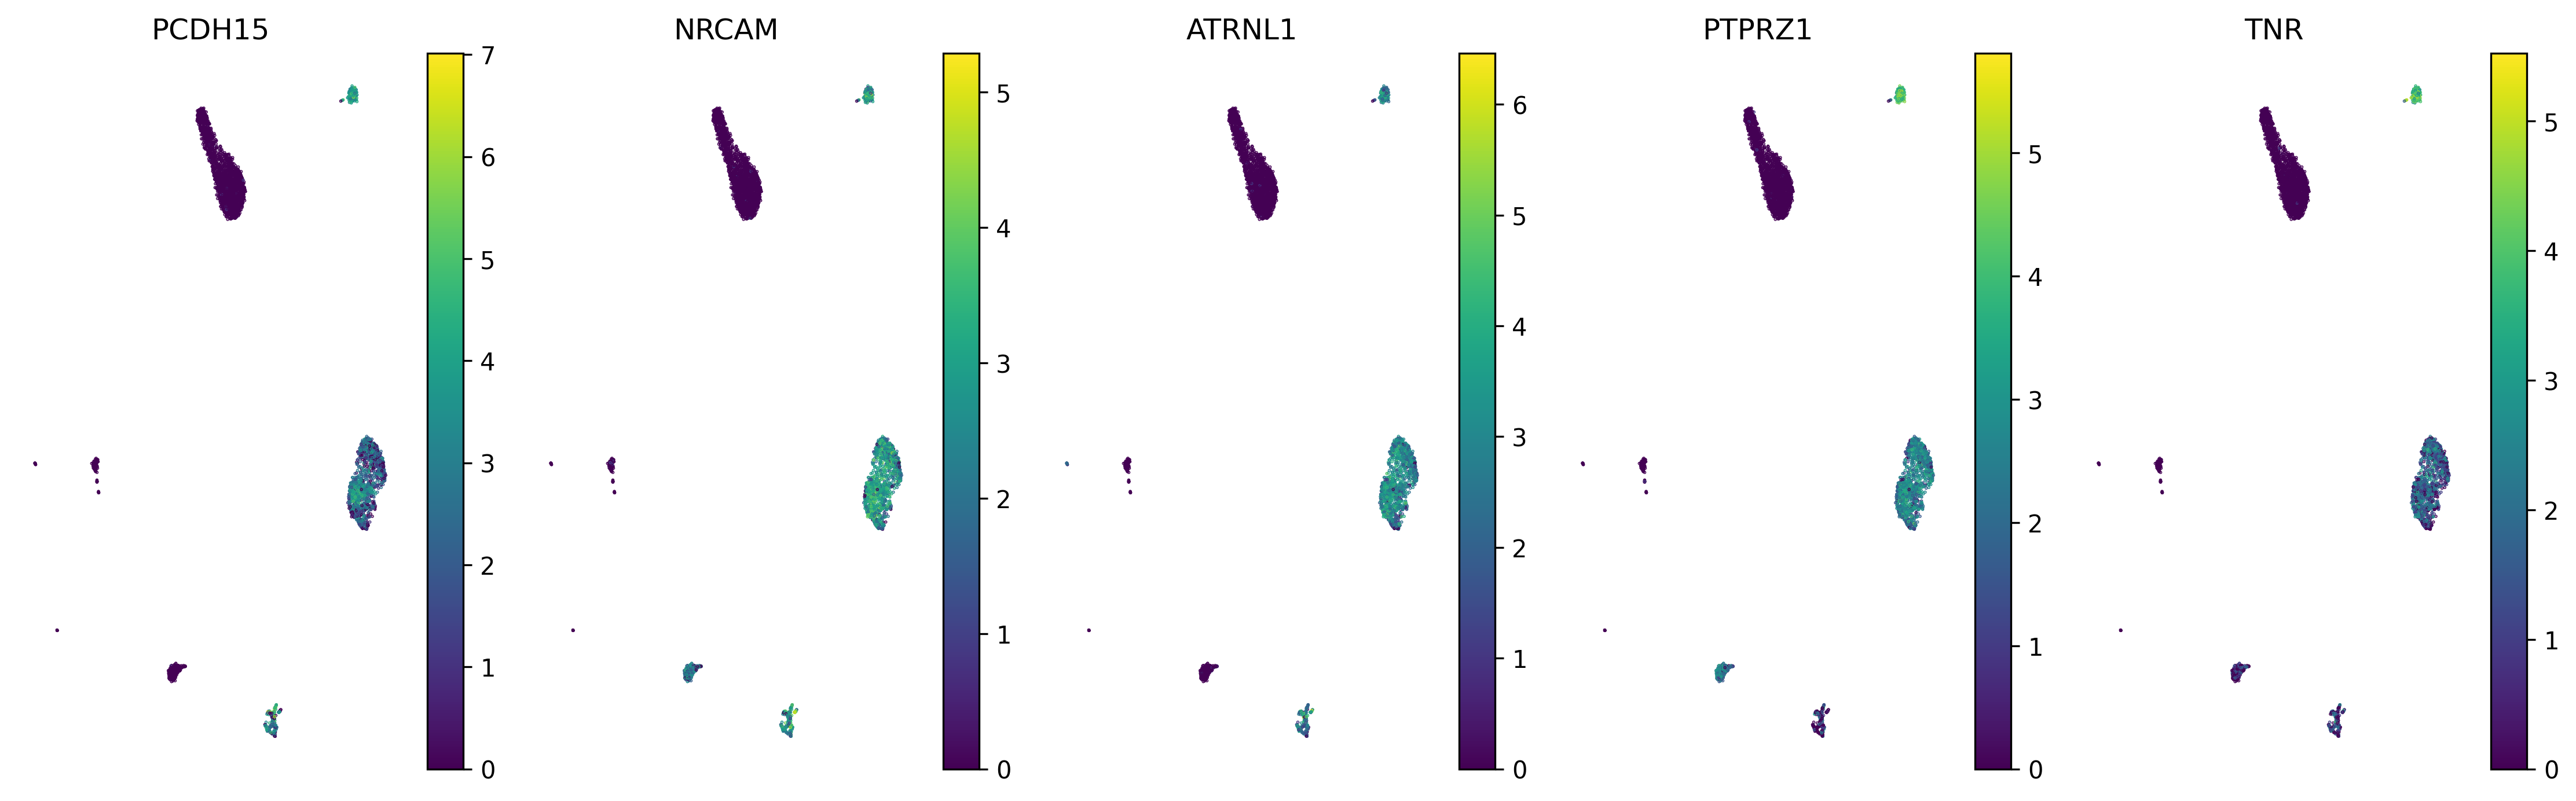
Color the visualization results using the expression levels of the marker genes
CellScope.gev.scatter_gene_expression(fea_log,Y_initial,marker_gene_indices,marker_gene_name,figsize=(15, 9), subplot_size = None,
                        save_fig=False, save_path=None)
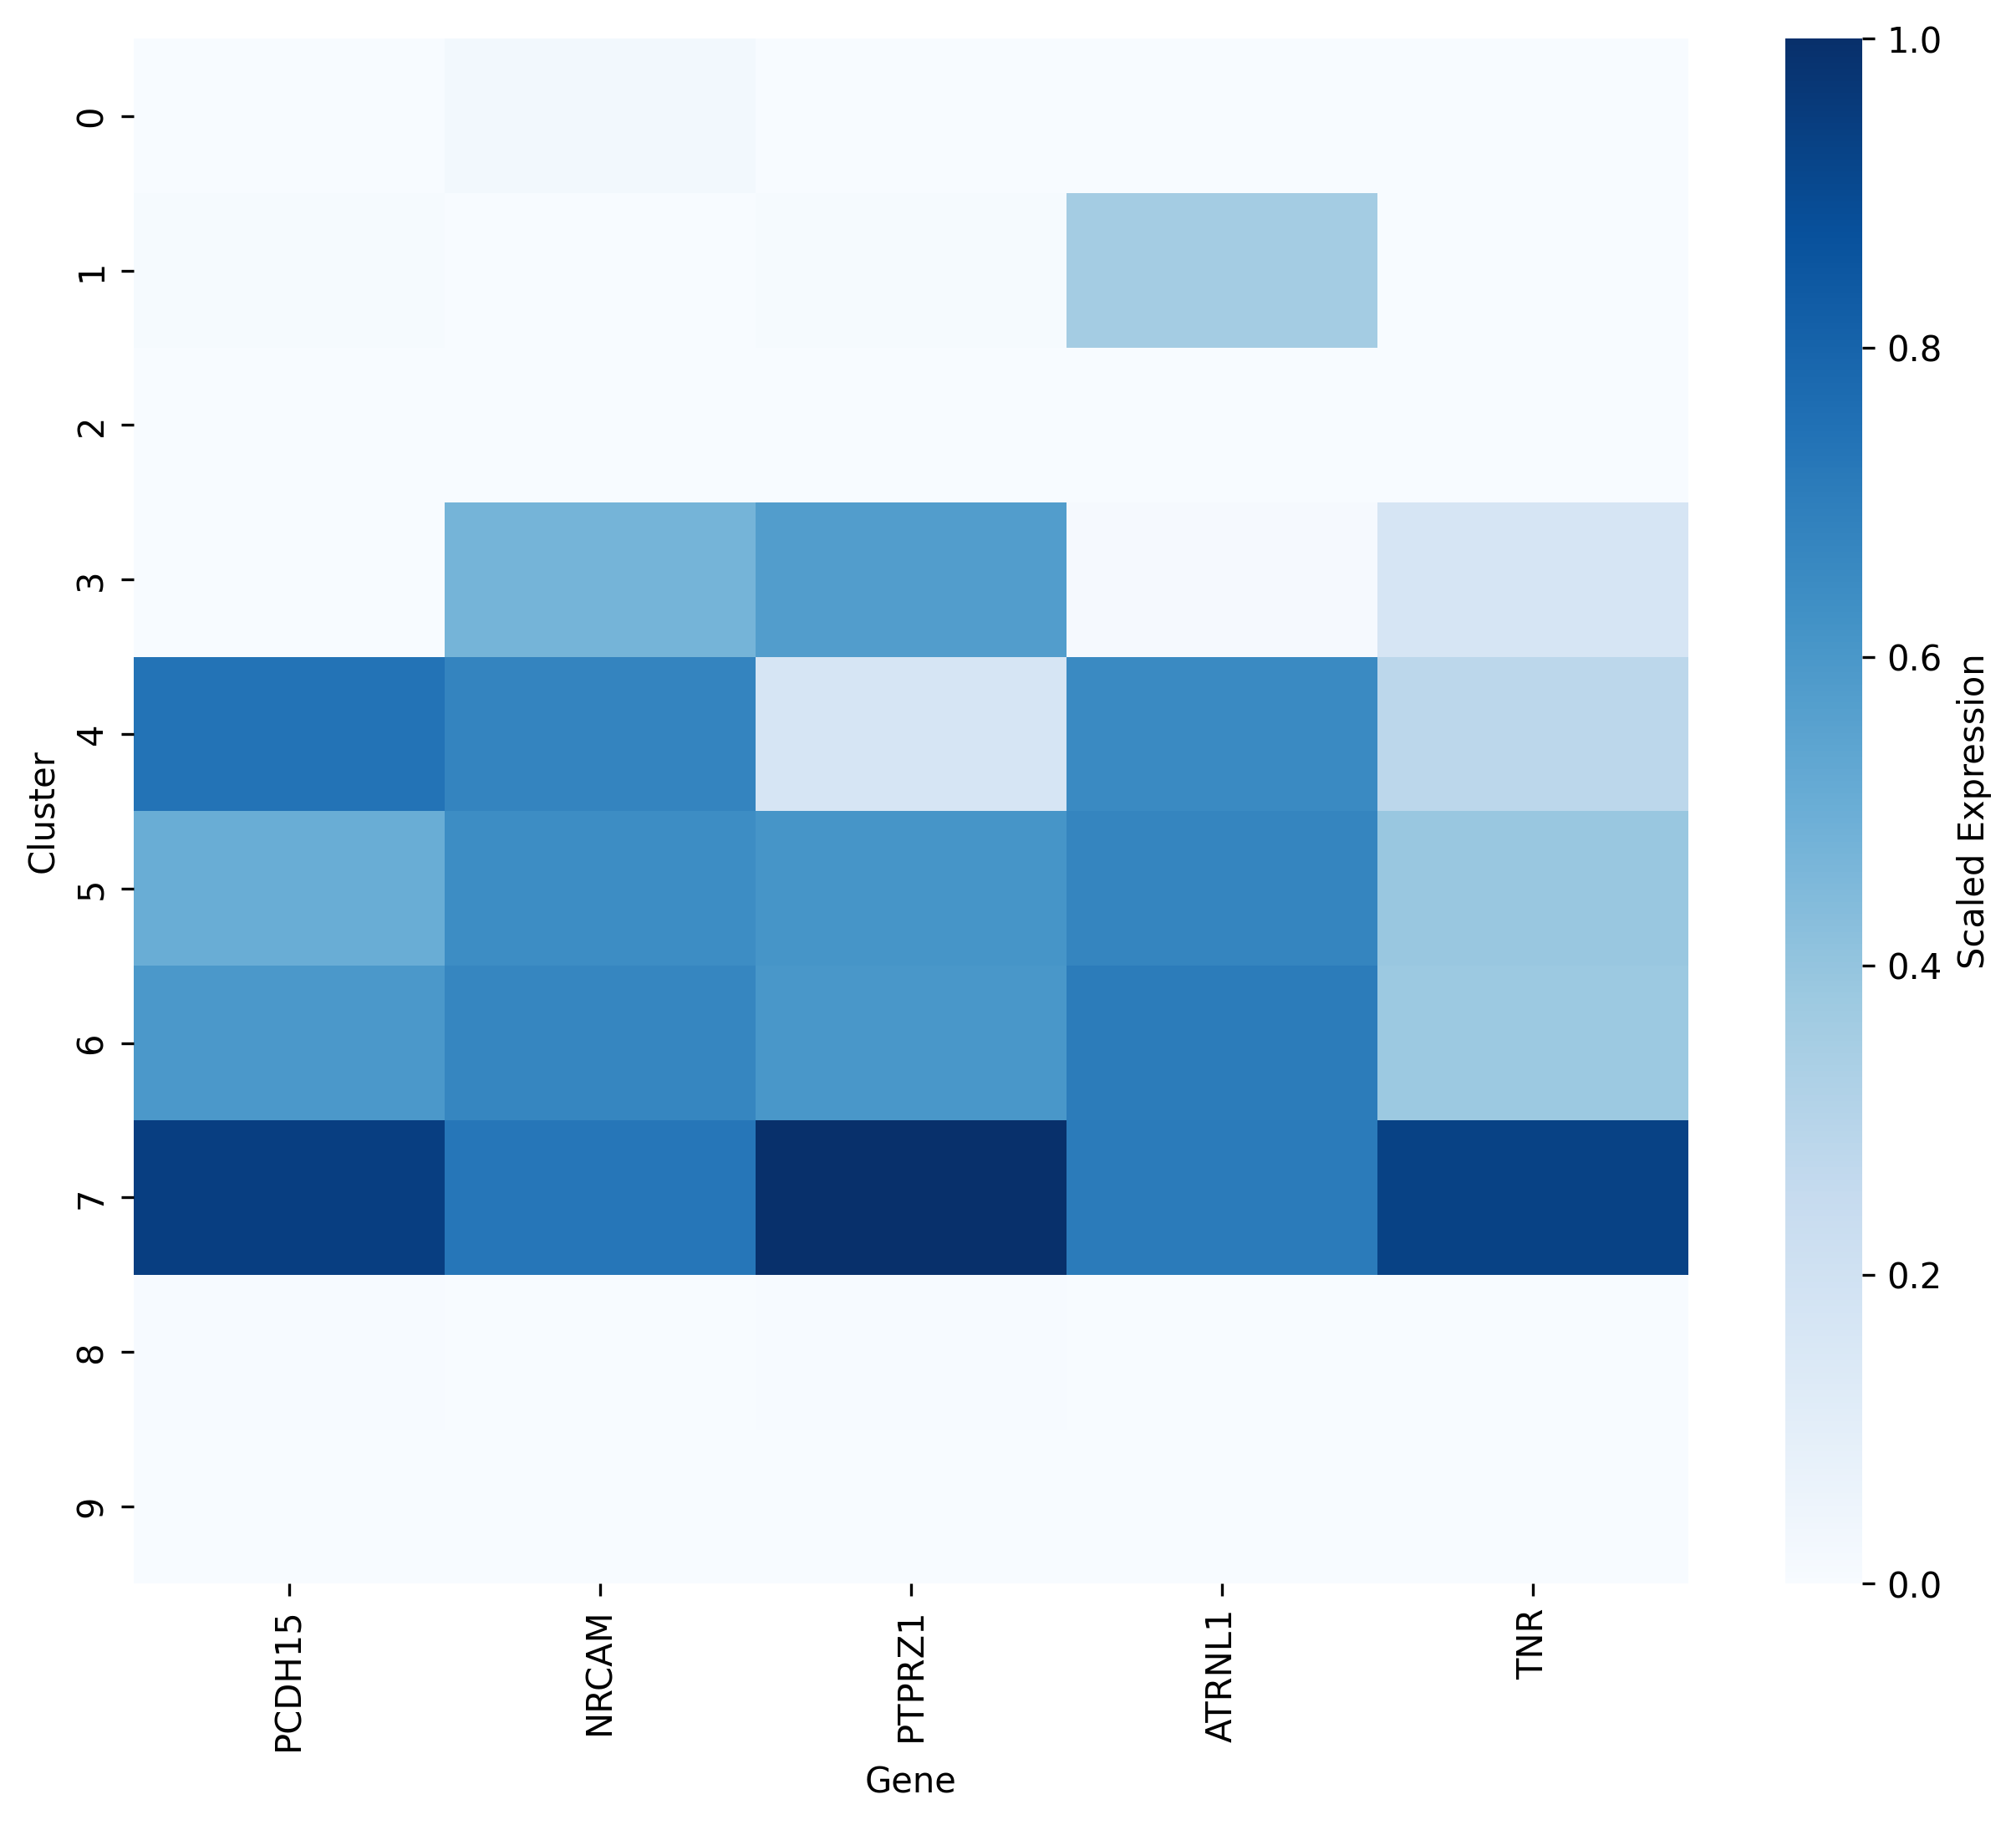
Plot the mean expression heatmap of genes across different cell groups
CellScope.gev.plot_mean_expression_heatmap(fea_log, marker_gene_indices,marker_gene_name, label)
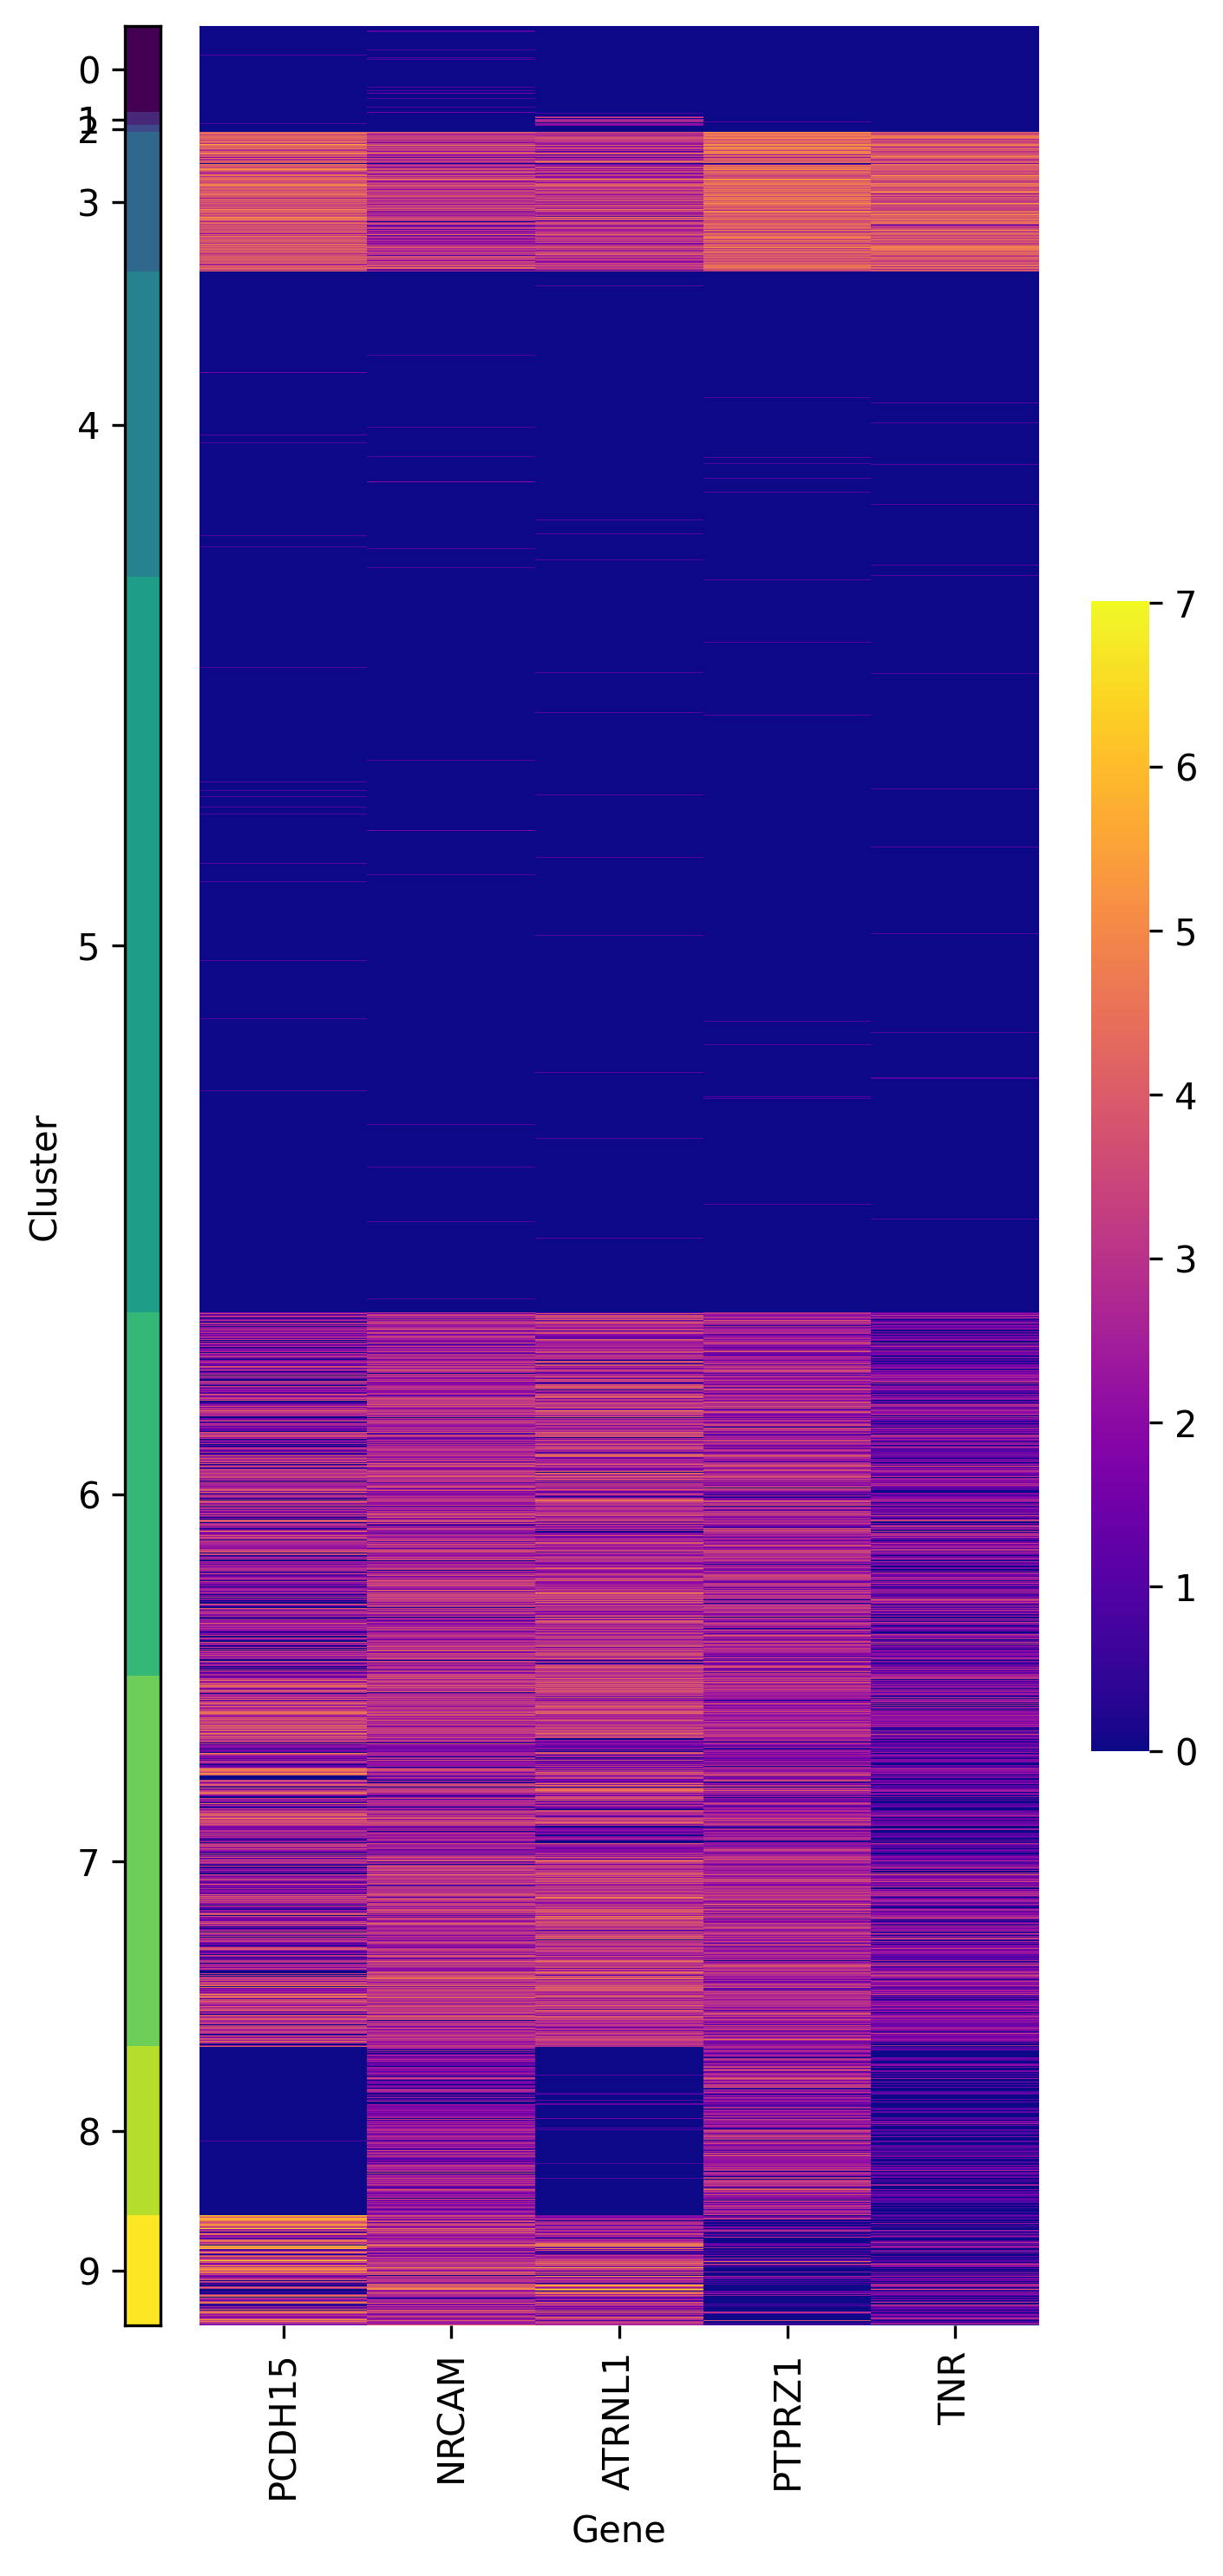
Plot the expression heatmap of marker genes across different cell types
CellScope.gev.plot_clustered_heatmap(fea_log, marker_gene_indices, marker_gene_name,
                       label, save_fig=False, save_path=None)
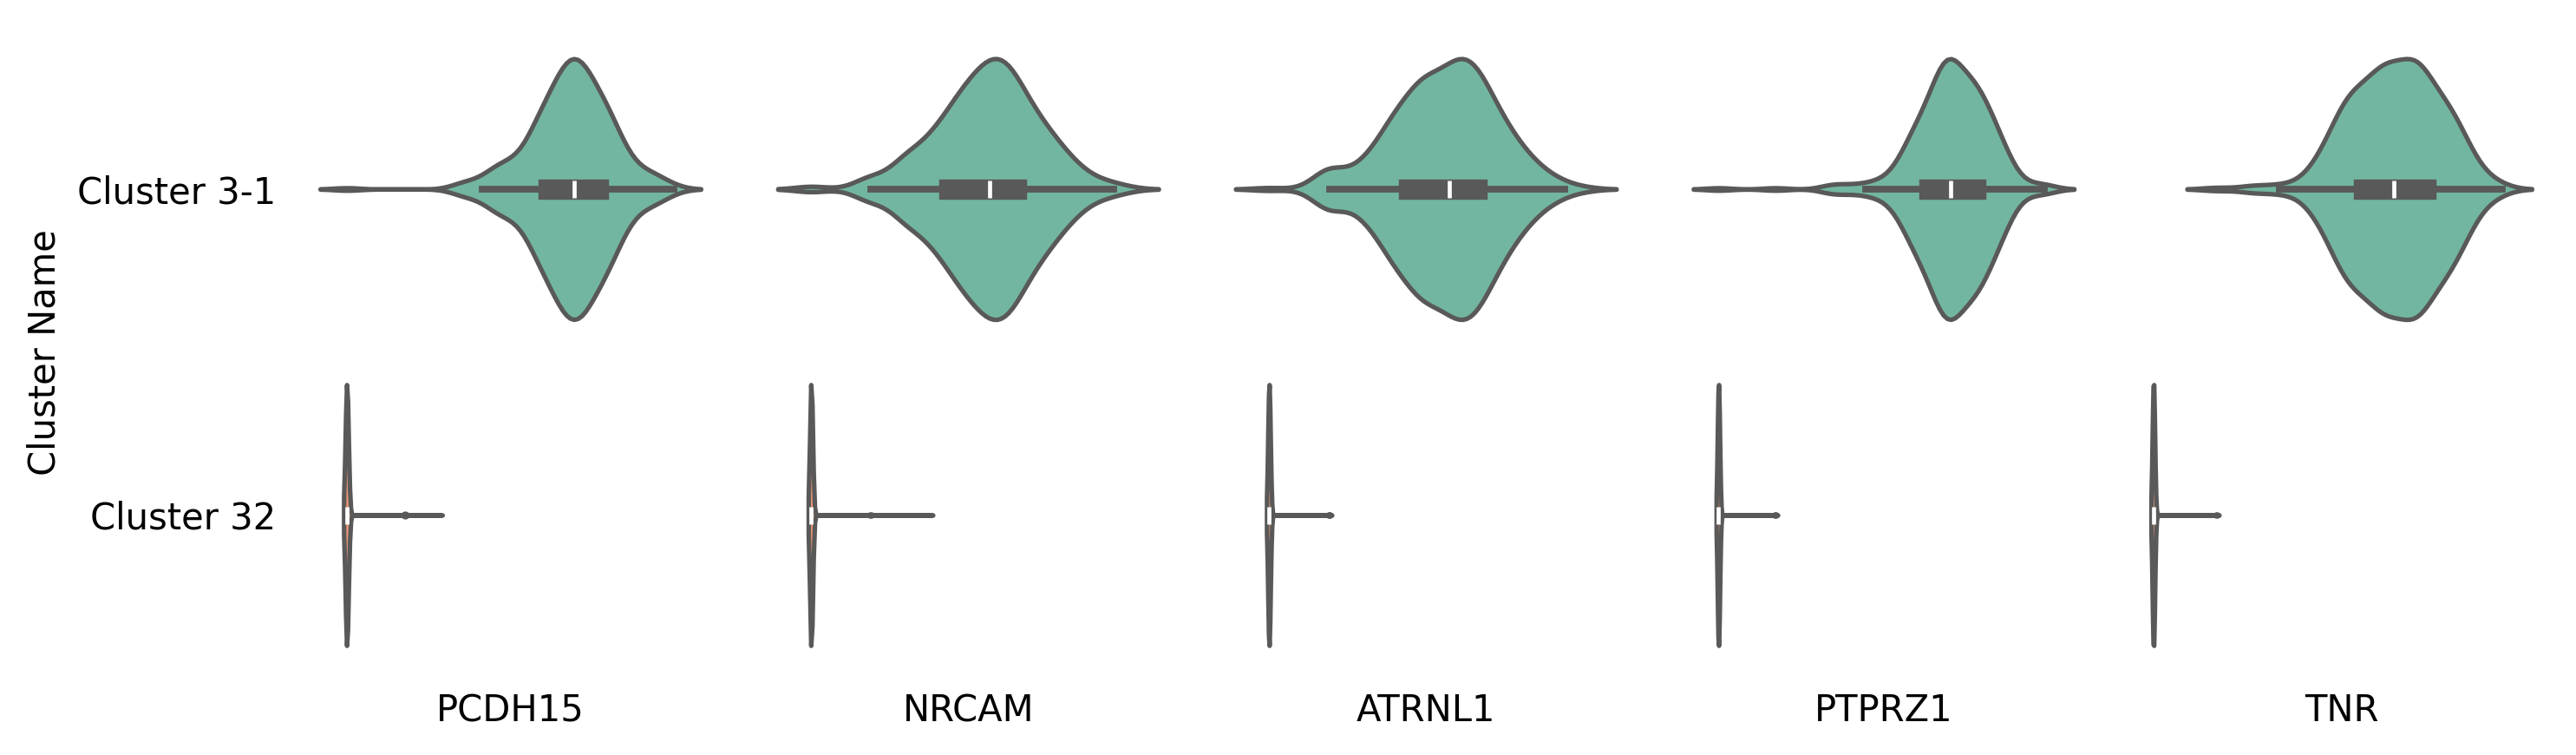
Plot violin plots to compare the expression levels of marker genes between different classes
CellScope.gev.compare_violin_plot_between_classes(fea_log, marker_gene_indices, marker_gene_name,
                                    cluster1, cluster2, class_name=['Cluster 3-1', 'Cluster 3-2'],
                                    figsize=(10, 3), save_fig=False, save_path=None)